Best command line tools used to measure the load and performance of your Linux system

1. Find the load and average load of the system: “w”.
w displays information about the users currently on the machine, and their processes. The header shows, in this order, the current time, how long the system has been running, how many users are currently logged on.
The following entries are displayed for each user: login name, the tty name, the remote host, login time,idle time, JCPU, PCPU, and the command line of their current process.
DESCRIPTION
w displays information about the users currently on the machine, and their
processes. The header shows, in this order, the current time, how long the system has been running,
how many users are currently logged on.
The following entries are displayed for each user: login name, the tty name, the remote host, login time,idle time, JCPU, PCPU, and the command line of their current process.
shanky@linux-host:>w
16:09:59 up 158 days, 19:13, 1 user, load average: 0.00, 0.04, 0.01
USER TTY LOGIN@ IDLE JCPU PCPU WHAT
shanky pts/1 16:07 0.00s 0.09s 0.01s w
“w” command will also tell you the uptime duration of your system.
The three values of load average are the load averages of last minute , last 5 min, last 15 minutes. So here, 0.00 is the load average of last minute,0.04 is the load average of last 5 minute and 0.01 is the load average of last 15 minutes.
Note:- The thumb rule says : the load values should not be greater than the numbers of processors installed in the system. Lets say if there are 8 processors installed on the system, we have load values like 10.34. 12.32, 9.32; we have problem here. The processes have to wait in the queue which can lead to performance issue.
We might need to restart the server or the some set of processes.
2. Check the uptime of the system:
shanky@linux-host:> uptime
4:10pm up 158 days 19:13, 1 user, load average: 0.00, 0.04, 0.01
This will tell you by how long the system’s been up and running. As you see in the above output, the system is up by 158 days and 19:13 hrs.
3. TOP is the most commonly used command to identify all process with their CPU time and memory utilization.
The top program provides a dynamic real-time view of a running system. It can display system summary information as well as a list of tasks currently being managed by the Linux kernel. The types of system summary information shown and the types, order and size of information displayed for tasks are all user configurable and that configuration can be made persistent across restarts.
shanky@linux-host:> top

4. Identify zombie processes and kill them
Identify zombie processes and kill them as they consume CPU processes very much and affects processing of other jobs .
To get process id of zombie process
shanky@linux-host:> ps aux|awk '$8=="Z" {print $0}'|tr -s " "":"|cut -d ":" -f 2
00 [python] <defunct>
Identify zombie process
shanky@linux-host:> ps aux|awk '$8=="Z" {print $0}'
root 22289 0.0 0.0 0 0 ? Z Aug29 0:00 [python] <defunct>
Identify the time consumed by a process. If it’s more than expected time duration, it can be killed.
5. Manually identify the CPU time consumption of a process:
Below will print all process with their CPU time consumed
ps -fu username | sort -k 7 | grep -E -v '00:00:00'| awk ' { printf ( "%s %s %s %s %s\n", "CPU time consumed by process", $8, $9,":", $7) }'
Now if you want to find out which process is using CPU for more than 10 minutes, we can use below command which will just filter the output of above command.
To get minutes of processes:
min=$(ps -fu shanky | sort -k 7 | grep -E -v '00:00:00|netmaster'| awk ' { printf ( "%s %s %s %s %s\n", "CPU time consumed by process", $8, $9,":", $7) }'|awk '{ printf("%s\n", $9)}' |cut -d ":" -f 2)
Below command will print the time if the process is consuming more than or equal to 10 minutes
ps -fu shanky | sort -k 7 | grep -E -v '00:00:00|netmaster'| awk ' { printf ( "%s %s %s %s %s\n", "CPU time consumed by process", $8, $9,":", $7) }'|awk '{ printf("%s\n", $9)}' |cut -d ":" -f 2|grep -i [1][0-9]
6. vmstat:Report virtual memory statistics
vmstat reports information about processes, memory, paging, block IO, traps, and cpu activity.
shanky@linux-host:> vmstat
procs -----------memory---------- ---swap-- -----io---- -system-- -----cpu------
r b swpd free buff cache si so bi bo in cs us sy id wa st
0 0 0 61976 150572 7574548 0 0 7 64 0 0 0 1 99 0 0
7. lsof: identify or list files opened by each process
One of the main reasons for using this command is to find out which file of a mount-point is open or being used. When a disk cannot be un-mounted and displays the error that files are being used or opened. With this command you can easily identify which files are in use.

8. Htop: More advance version of top
Htop is a free (GPL) ncurses-based process viewer for Linux. It is similar to top, but allows you to scroll vertically and horizontally, so you can see all the processes running on the system, along with their full command lines.
Tasks related to processes (killing, re-nicing) can be done without entering their PIDs.

9. iotop : command related to “top” but mainly focuses on I/O operations.
10. Iptraf: Interactive Colorful IP LAN Monitor
DESCRIPTION
iptraf is an ncurses-based IP LAN monitor that generates various network statistics including TCP info, UDP counts, ICMP and OSPF information, Ethernet load info, node stats, IP checksum errors, and others.
If the command is issued without any command-line options, the program comes up in interactive mode, with the various facilities accessed through the main menu.
shanky@linux-host:> iptraf
IPTraf Version 3.0.0
Copyright (c) Gerard Paul Java 1997-2004l
This program can be run only by the system administrator
11. psacct
12. netstat
13. collectl: Collects data that describes the current system status.
Record Mode - read data from live system and write to file or display on terminal. In this mode data is taken from a live system and either displayed on the terminal or written to one or more files or a socket.
collectl [-f file] [options]
Playback Mode - read data from one or more raw data files and display on terminal. In this mode, data is read from one or more data files that were generated in Record Mode.
collectl -p file1 [file2 ...] [options]
Collectl is another powerful and feature rich command line based utility, that can be used to gather information about Linux system resources such as CPU usage, memory, network, inodes, processes, nfs, tcp, sockets and much more.
It displays statistics on cpu, disk, infiniband, lustre, memory, network, nfs, process, quadrics, slabs and more in easy to read format.
shanky@linux-host:> collectl
waiting for 1 second sample...

14. To get cpu details or count of processors in the system.
to get number of processors:
shanky@linux-host:> grep -i processor /proc/cpuinfo|wc -l
2
view /proc/cpuinfo

15. To get memory information of the system
shanky@linux-host:/proc:> cat meminfo

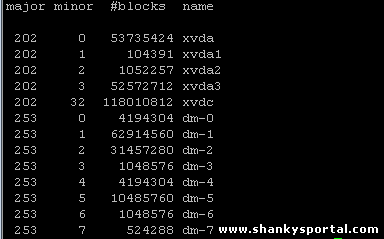
16. View partition details
shanky@linux-host:/proc:> cat partitions
17. Stat:- display file or file system status
Format:
stat [OPTION] FILE...
shanky@linux-host:> stat untilLoop.ksh
File: `untilLoop.ksh'
Size: 108 Blocks: 8 IO Block: 4096 regular file
Device: ca03h/51715d Inode: 3108550 Links: 1
Access: (0664/-rw-rw-r--) Uid: (386399/ shanky) Gid: (33546/ qxbmw)
Access: 2014-04-29 15:11:28.000000000 +0200
Modify: 2014-04-29 15:08:18.000000000 +0200
Change: 2014-04-29 15:11:15.000000000 +0200
So as we can see , stat stats the detailed information about of the file “untilLoop.ksh” with attributes such as size, blocks, type, owner, group access timestamps etc.
Click here to know more about stat command.
18. sar: Collect, report, or save system activity information.
DESCRIPTION:
The sar command writes to standard output the contents of selected cumulative activity counters in the operating system. The accounting system, based on the values in the count and interval parameters, writes information the specified number of times spaced at the specified intervals in seconds.
The “sar” command extracts and writes to standard output records previously saved in a file. This file can be either the one specified by the -f flag or, by default, the standard system activity daily data file.
The default version of the sar command (CPU utilization report) might be one of the first facilities the user runs to begin system activity investigation, because it monitors major system resources. If CPU utilization is near 100 percent (user + nice + system), the workload sampled is CPU-bound.
Options:
-b: Report I/O and transfer rate statistics. The following values are displayed:
tps
Total number of transfers per second that were issued to physical devices. A transfer is an I/O request to a physical device. Multiple logical requests can be combined into a single I/O request to the device. A transfer is of indeterminate size.
rtps
Total number of read requests per second issued to physical devices.
wtps
Total number of write requests per second issued to physical devices.
bread/s
Total amount of data read from the devices in blocks per second. Blocks are equivalent to sectors with 2.4 kernels and newer and therefore have a size of 512 bytes. With older kernels, a block is of indeterminate size.
bwrtn/s
Total amount of data written to devices in blocks per second
|  Some useful examples of netstat command in Linux for network statistics
  uptime command in Linux
  Some amazing command shortcuts in Linux
  Traceroute command in Linux